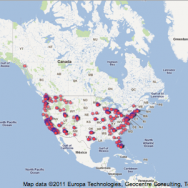
 Not unlike other superstores around the world, Costco’s presence has had somewhat of a profound impact on our consumeristic lives. The ability to purchase goods at larger than normal quantities, sometimes well below average retail value, makes it an attractive shopping experience. The first Costco opened in San Diego, California, 1976. It’s growth shows wildfire-like spread throughout the United States west coast. It is only in the mid-to-late 90’s which show remarkable expansion of Costco locations to central and eastern United States..
Mapping & Managing Time-Series Data
There are many ways to go about mapping time-series data. One could create a video montage of keyframes, showing store by store, the additions of Costco locations around the United States. There are a number of tools included in GIS softwares that allow for time-series data exploration, including those for ArcMap and QGIS. Or if you are like me, and you want to explore web-mapping technlogy for this type of project, you can use Google Maps API. By manipulating the example code shown here, I was able to create a web map that loads all 417 Costco locations and drops them on top the map using custom markers (Costco colours!) to represent the growth of Costco over time.
The Costco data is available in CSV format from Locations Complete. It requires a little bit of massaging to work with the Google API… lucky for you, by visiting this page, you can view and copy/download my code if you wish.
I have to admit, I draw much inspirations from Flowing Data and his growth of Walmart animation, and similarly, the growth of Costco animation.
Click on the map ↓ to view the animation!
For those that might have any tips on integrating the drop() function and the markerClusterer tool, please get in touch!
Cheers!
- 26 Sep ’11
- Posted by Michael
- Add comments
- General
- analysis, costco, geo-visualization, map, map overlay, spatial, web

