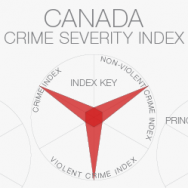
Working with the Crime Severity Index has been an interesting exercise. The data are available through Statistics Canada, which tracks police-reported crime severity as well as the volume of reported crimes. The Crime Severity Index offers a secondary measure that helps us to understand more about the crimes committed per Province. Generally speaking, severity of crime is not correlated with the volume of crime committed, but there are certainly some outliers. We inherit the inability to determine whether or not these correlations actually prove to be true when studying data aggregated to such a large (Provincial) extent. It is unethical to assume that the average Crime Severity for a Province is displayed throughout the entire Province itself. The illustration below provides a unique method of investigating multivariate (multi-dimensional) statistics. We can compare and contrast the intra– and inter-provincial differences in the three independent variables, Crime Severity Index, Non-Violent Crime Severity Index and Violent Crime Severity Index.
Zoomified!
Full resolution available for download: HERE
By utilizing a standardized unit of measure, the “spokes” of one variable can be compared across all Provinces. Therefore, a spoke length measuring 25% of the maximum standardized length (refer to the Index Key), would represent 1/4 as much crime severity as the maximum severity displayed by that variable. As an example, the Northwest Territories report about 9x greater violent crime severity than that reported in Ontario.
Let me know if I can improve upon the illustration in any way!
Cheers!
More information here: Crime Severity Index via Statistics Canada

[…] de politie (ook in het VK). Dit wordt in vaktermen ook wel Crime Mapping (1, 2, 3, 4) genoemd. Behalve het maken en kwalitatief analyseren van criminologisch interessante foto’s […]