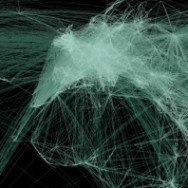
 I guess we can call this part two of the global connectivity by flight experiment, which I have been working on the past couple of days. Once again, the data comes from openflights.org/data.html and is available for free to the public. It is a very detailed set of data that requires just a little bit of massaging to be usable in a desktop work environment. In this blog post I would like to take you through some quick helpful tips that should get you from downloading the data and cleaning it up to mapping it in ArcMap. In all honesty, I would have loved Continue reading »
 My intentions for this blog are to spur intelligent and thought provoking discussions and to provide some insight and/or help to those who may want to delve into various spatial analyses and cartographic trends/methodologies. Cartograms are definitely one of the most trending topics in discussions on how to alternatively geovisualize spatial phenomena. The idea roots back more than half a decade and has evolved from a ‘pencil and graph paper’ skill to a geographical information system (GIS) tool{box}. We can add… Continue reading »
 An earthquake measuring in at 5.9 magnitude, hit Virginia (epicentre) at approximately 17:51:03 GMT. I am writing this post from my office at Ryerson University, Toronto, Ontario, where we also felt the ground move beneath us.… Okay, to be frank, I didn’t feel anything. But my classmates and colleagues have reported that they felt the earthquake. Now, the reason why I am posting about this, is not exactly because I think the earthquake was that significant and worth mentioning. I would like to share with you a little map that I created a few Continue reading »
